The power was out again. Sitting in a darkened room in western Senegal, the man talked happily about how the arrival of electricity a decade ago had transformed life in the village of Gaouane. But becoming accustomed to reliable electricity had an unexpected downside: “Now when the power goes out, it feels even darker than before we had electricity!”
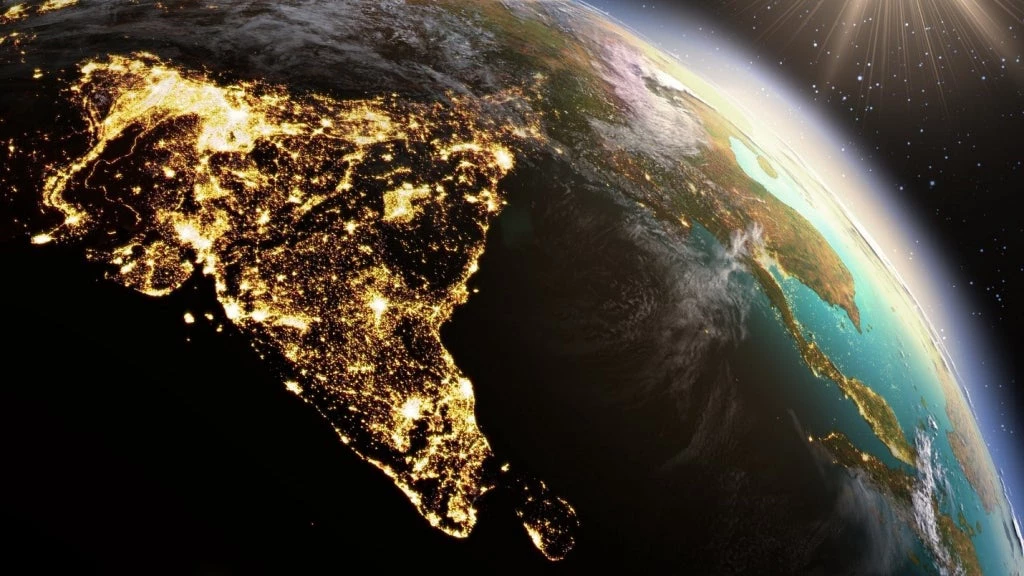
Tracking access to sustainable and reliable energy remains a pressing challenge in much of the world. New and open data and tools are changing how we meet these and other needs to measure economic activity in near real-time. Satellite nighttime light data provides an unprecedented perspective upon every corner of the planet to identify energy access and quality gaps, as well as trends in economic activity. The World Bank and its partners have been at the forefront of this charge. Supported by an early World Bank Innovations Fund grant, Kwawu Gaba and Brian Min compared ground-based data from hundreds of West African villages, including in Gaouane, against nighttime satellite imagery. This was the first study to directly detect rural electrification at the village level using satellite imagery.
In the last several months, the World Bank has been using nighttime light studies to monitor the COVID-19 pandemic to better understand the impacts of the pandemic on energy consumption, transportation, social interactions, the functionality of critical infrastructure, or the impact of a differential relaxation of containment policies on aggregate economic activity (for example, in India). One study is focused on 50 cities spanning 18 countries across the Middle East and North Africa (MENA) to evaluate changes in nighttime lights as a proxy for changes in economic activity the role of lockdowns and other NPIs in these changes (see a recent blog by Roberts et al., here).
Many of these studies that used DMSP data for trends over time required a special data pull from NOAA servers in Colorado. Since the 1990s, NOAA has archived all nighttime satellite imagery of the world, across changing servers and storage technologies over time. For a period, the only copies of the oldest data sat on magnetic tapes in a protected storage bay. NOAA regularly produced annual composites of the DMSP data and monthly composites of the VIIRS archive, but getting data from a specific night or set of nights has always been laborious. That changes today.
The World Bank’s Light Every Night (LEN) data set emerges from a decade-long collaboration between the World Bank, NOAA, and the University of Michigan. This collaboration was driven mainly by Kwawu Gaba, a Lead Energy Specialist from the World Bank. The work was sustained by several World Bank projects, each building on prior efforts to scale-up the work, by contributing a share toward the data conversion process, from tape to cloud (DMSP), and developing open algorithms and knowledge to enhance the data.
The LEN data set consists of the complete archive of all nighttime imagery captured each night over the last three decades. The underlying data is sourced from the NOAA/NCEI archive (DMSP-OLS with data from 1992-2017, and the VIIRS-DNB with data spanning 2012-2020). The World Bank worked in collaboration with NOAA/NCEI and the University of Michigan to publish the archive as an Analysis Ready Data Set. The LEN archive, which now spans nearly 250 terabytes and is published under the World Bank’s open data license, is available on the AWS open public data set program. The data includes:
DMSP-OLS nightly imagery (1993-2017, all nights):
- Visible-near infrared (VIS)
- Long-wave thermal infrared (TIR)
- lunar illuminance (LI)
- cloud mask (CM)
- sample position (SAM)
- stray light mask (SLM)
VIIRS DNB nightly imagery (2012-2020, all nights):
- DNB radiance
- I5 (LWIR) radiance
- lunar illuminance
- sample position within DNB scan
- quality bitflag or "vflag" grid with on/off states for these fields:
- daytime/nighttime/near-terminator
- zero lunar illuminance
- VIIRS cloud mask
- nightfire detection
- lightning
- high energy particle hit
- stray light affected/corrected
The Light Every Night data set published on the Amazon Web Services Registry of Open Data on AWS is designed from the ground up to be Analysis Ready Data in the cloud. The data is published under the Amazon Web Services Open Data Program using the Cloud Optimized GeoTIFF format (COG) and organized using the Spatial Temporal Asset Catalog (STAC) specification. The growing body of standards and tools in the Analysis Ready Data ecosystem is making it easier for broader audiences and developers alike to discover, process, and analyze geospatial data.

Increasing the availability of granular remotely sensed nighttime light observations opens the door to new possibilities to understand how the Earth is changing, and to utilize these insights to improve decision making , to guide policy, to deliver services, and to improve governance in near real-time. The LEN data and ecosystem of tools and tutorials will continue to evolve and are already being used towards many applications in the World Bank.
- Nightlights.io enables data visualization of light output patterns for 600,000 Indian villages over two decades
- HREA project uses computational models to estimate electricity access and reliability at settlement-level since 2012
- Lighting Pakistan used VIIRS data to help identify priority areas for the distribution of solar lanterns
- Measure economic growth, urbanization, and land use change, (see the 2018 Former Yugoslav Republic of Macedonia Systematic Country Diagnostic; predict GDP per capita in South Asia;
- Monitor economic impacts of past, current, and future transportation projects (e.g. local economic activity in Asia)
- Evaluate how humans adapt and respond to natural hazards and disasters (CityScan and the City Resilience Program - CRP)
To accelerate research efforts and applications, the World Bank has developed tutorials and guidelines regarding nighttime lights data processing and use, found here. The tutorials review the background of remote sensing, help users understand the data involved, and guide them through interactive modules to learn some of the key tools, including Python for statistical programming and Google Earth Engine, and basic operations, such as accessing and visualizing images, performing transformations and calculations, such as zonal statistics, and statistical analysis and plotting, and development of methods and tools for inter-calibration between DMSP-OLS and VIIRS to make them compatible across time. While there are other valuable nighttime light data sets, the LEN data set and tools support a “Do-It-Yourself” approach to learning and working directly with the data and algorithms. The ecosystem of tools and tutorials will benefit from an active community working with the data and making contributions to improve its value and utility for evidence-based policy in sustainable development.
Links:
- Light Every Night (LEN) data set
- Open Nighttime Light Tutorials for processing, analyzing, and developing data products from nighttime light
For information on how to contribute to the open tools repository, contact GOST@worldbank.org. The LEN data set was supported by contributions from several World Bank projects, major funding support provided by “Innovations in Big Data for Development”, the “Tracking Light from the Sky Project”, WBG Energy Practice, and by the World Bank’s Trust Fund for Statistical Capacity Building (TFSCB) with financing from the United Kingdom’s Foreign, Commonwealth & Development Office (FCDO), the Government of Korea, and the Department of Foreign Affairs and Trade of Ireland.


Join the Conversation