The Uganda Bureau of Statistics (UBOS), in collaboration with the World Bank’s Living Standards Measurement Study (LSMS) program and the Poverty and Equity Global Practice, disseminated the microdata, survey report and tabulations from the second round of the Uganda High-Frequency Phone Survey on COVID-19 (UHFPS) on November 2, 2020.
The UHFPS was launched in June 2020 to track the socio-economic impacts of the pandemic on a monthly basis, for a period of 12 months. The second round was implemented in July-August 2020. The survey aims to recontact the entire sample of households that had been interviewed during the Uganda National Panel Survey (UNPS) 2019/20 round and that had phone numbers for at least one household member or a reference individual. Of the 2,421 households targeted 2,227 households were interviewed in round 1, and of those, 2,199 were interviewed in round 2.
This blog discusses the key findings from the Uganda UHFPS Round 2 Survey Report.
There was a drastic decline in the reported prevalence of safe practices in the second round. Compared to the first round conducted in June, significantly fewer respondents reported following such safe practices as reducing the number of times going the market; avoiding groups of more than 10 people and physical greetings; and washing hands more frequently in the last 7 days prior to the interview in July-August. The change was observed across rural and urban areas and across both male and female respondents and can be associated with easing lockdown measures in the end of June.
Figure 1. Prevalence of safe practices across two rounds, % of respondents

The rural-urban gap in participation in any education or learning activities widened according to the findings in the second survey round. Respondents were asked in July-August about each child’s participation in any education or learning activities in the past 7 days—this represented a richer body of information on education vis-à-vis the first round. In turn, the information from the second round was used to construct a comparable indicator to the first round—participation of any child (3-18) in any learning activities at the household-level.
The lack of change in this variable at the national-level between the two survey rounds masks differences between households residing in rural versus urban areas. The share of households with at least one child participating in any education or learning activities declined slightly in rural areas (56 versus 54%) and increased in urban areas (67 versus 73%). This further widened the existing gap between rural and urban areas from 11 percentage points in the first round to 19 percentage points in the second round. Further, according to the data from the second round, only 42 percent of children (3-18) living in households in the poorest quintile engaged in any education or learning activities. The comparable estimate was 69% for children living in households in the richest quintile.
Figure 2. Share of households with at least one child (3-18) engaged in any education or learning activities (conditional on having at least one child) by survey round and rural/urban residence, (%)
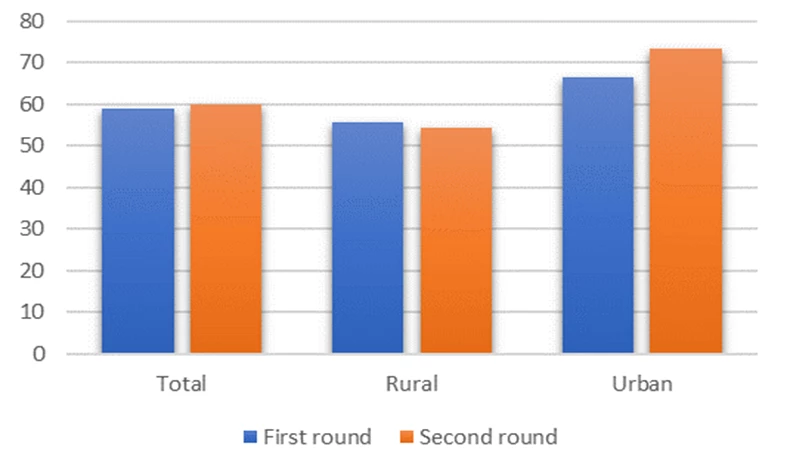
Figure 3. Share of households who had to borrow money since March 2020 to face the COVID-19 emergency, (%)
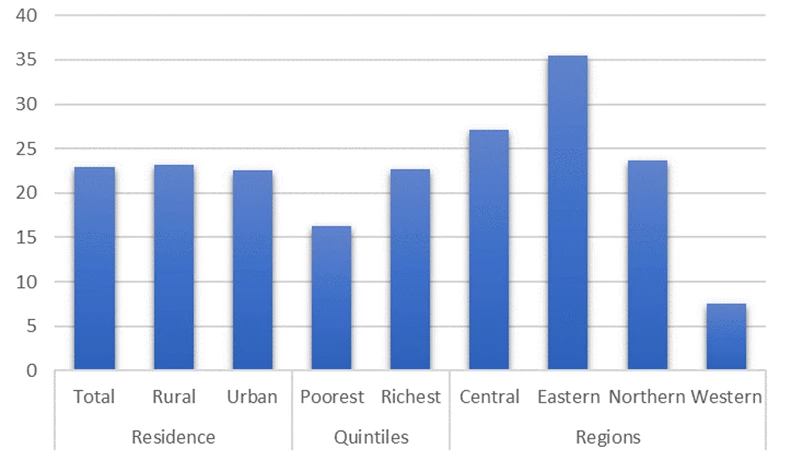
Figure 4. Reasons why households had borrowed since March 2020, by rural/urban residence, region and pre-COVID-19 household per adult equivalent consumption quintiles, (%)
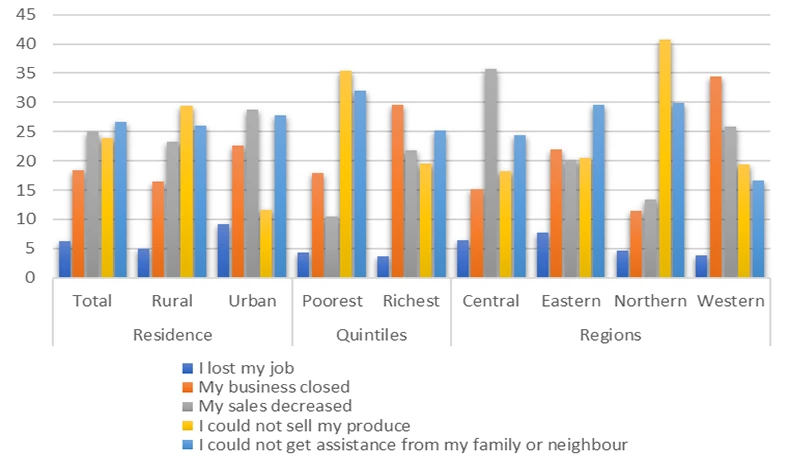
Slightly more than 20% of households had to borrow irrespective of whether they were living in urban or rural areas. Households from the poorest quintile were least likely to borrow money (Figure 7). Those who had to borrow to face COVID-19 emergency situations were asked why they had to do so (Figure 8). The largest share of households had to borrow (27%) because they could not get assistance from family or neighbors. Several reasons were related to the situation in the labor market and overall economy. About 18% of respondents mentioned closure of business, 24% inability to sell produce, and 25% mentioned a reduction in sales.
Figure 5. Share of respondents working before the COVID-19 outbreak and during the last 7 days preceding each round of interview, by rural/urban residence and pre-COVID-19 household per adult equivalent consumption quintiles, (%)

Based on the second round of interviews, (July/August 2020) the employment situation was picking up back to pre-COVID-19 levels. Overall, the share of respondents reporting to have worked in the week preceding the second round of interviews (87%) recovered to the pre-COVID-19 level before March 20th when lockdown was introduced. However, recovery process was not universal leaving urban areas behind. Thus, the share of working respondents was 4 percentage points higher than the share pre COVID-19 in rural areas. While in urban areas, the share of working respondents was still 8 percentage points lower with respect to pre-COVID-19 levels. Consistent with this finding, the share of working respondents increased to levels higher than March 2020 in the three lowest quintiles, while the upper two quintiles still lagged behind the pre-COVID19 levels.
Although the shares of working respondents were still behind the pre-COVID-19 levels in urban areas and in the richest quintiles, there was a fast improvement. Indeed, there was a 19 percentage points increase in working respondents with respect to Round 1 both in urban areas and in the richest quintile.
Figure 6. Share of households receiving income from specific sources during last 12 month across two rounds, (%)
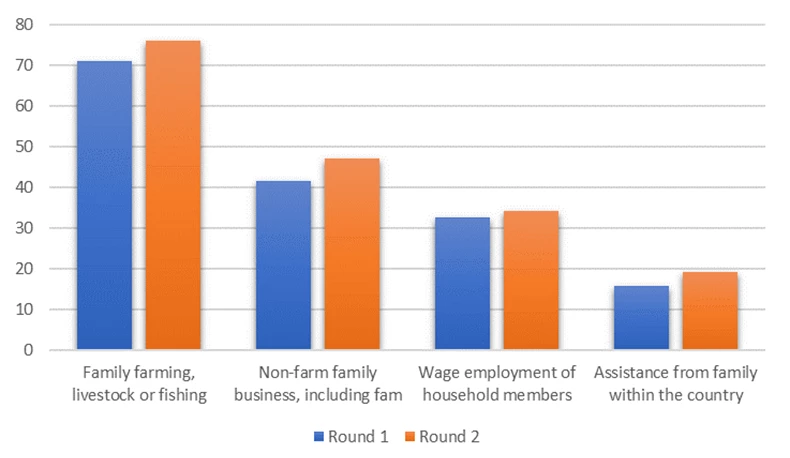
Figure 7. Changes in income by selected sources and across rounds, % of households
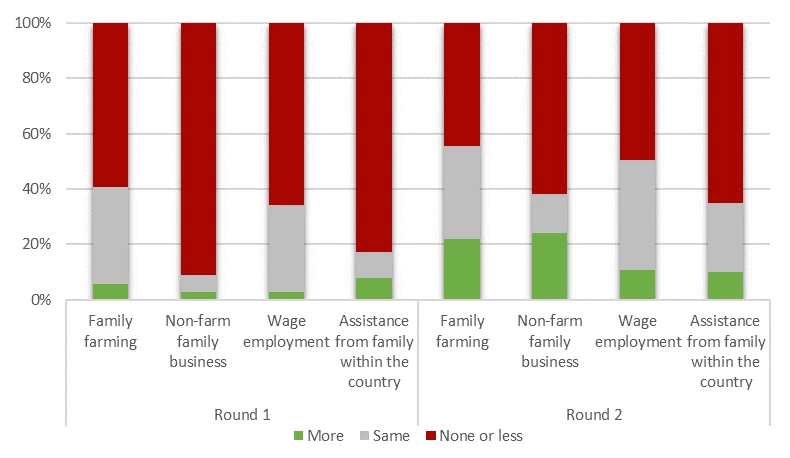
While significant recovery in employment was registered in July-August, there was still a very high rate of households reporting income losses even compared to the first round in June. By August, the share of households receiving income from each income source was higher than in June. The share increased from 42 to 47 percent for non-farm family business income, from 71 to 76 percent in agricultural income, and 16 to 19 percent concerning assistance from family within the country (Figure 10). Figure 11 shows the changes in income by source and over time. During the first round of interviews, respondents reported mostly losses or no earnings in all income generating activities since the onset of the pandemic. In the second round, fewer households reported a partial or total loss of income. For example, 61 percent of households in the second round reported full or partial loss in non-farm family business compared to the first round. Despite positive tendency, this comparison is made against the poorer position households were in at June—after three months in the lockdown.
Links to resources: Microdata from Uganda HFPS, Round 1 Survey Report and Tabulations, Round 2 Survey Report and Tabulations.
The members of the team working on the Uganda High-Frequency Phone Survey on COVID-19 (listed in alphabetical order for each institution) are: UBOS: Danstan Aguta, Henry Mubiru, Andrew Mupere, Vincent Ssennono; World Bank: Aziz Atamanov (Poverty and Equity GP), John Ilukor (LSMS), Talip Kilic (LSMS), Giulia Ponzini (LSMS), and Nobuo Yoshida (Poverty and Equity GP).


Join the Conversation