This is the story of an owl, but not any owl. This owl is from Seoul and it came into existence thanks to Big Data. How come, you may ask? Well, read on to find out.
Meet your new friend: the owl bus
Officials in Seoul had long searched for a transport system for low-income workers who commute late at night. Although a taxi ride was an option, it was a very pricey one, particularly for a commute on a regular basis. Low-income workers do not make enough money to take a taxi regularly, and taxi fares are considerably higher at night. Furthermore, since low-income workers tend to live on the outskirts of the city, taxi drivers often are reluctant to go there mainly for distance and security reasons.
These were some of the big challenges faced by policy makers in Seoul, a city regarded as a champion of public transportation. So what to do?
Part of the solution was the analysis and utilization of Big Data to come up with a suitable mode of transport that would serve the specific needs of late-night workers. The result was the creation of the “owl bus,” which operates late into the night until five o’clock in the morning.
In this context, Big Data has a considerable potential application in the transport sector, and for infrastructure development in general. In fact, World Bank and Korean officials will discuss on Tuesday, May 28 the theme “Leveraging
Information Communication Technologies (ICT) in transport for greener growth and smarter development.”
The workshop with leading experts from the
Korea Transport Institute (KOTI) will discuss opportunities related to Open Data and Big Data analytics; to lowering barriers for transport planning including operations and management of transport via functional ICT systems; and possibilities for injecting innovation via disruptive technologies and the Internet of Things.
The owl bus in Seoul, for example, was planned and designed to provide a minimum level of bus service for low-income workers during the period when all public transport services halt. How was the owl bus designed?
In general, bus routes are planned and designed with travel demands being predicted on the basis of sample survey data. This traditional approach brings about reasonable results. There are several limitations however in planning and designing late-night bus routes using a traditional approach, including:
First, costs. There are more than 20 million people in Seoul’s metropolitan areas, including adjacent cities. Accordingly, millions of dollars would be required for just a two to three percent sample survey.
Second, time. It takes a long time to plan and design bus routes through sample survey/analysis. From past experiences, it may take even a couple of years to analyze the information and data.
Third, viability. It is not that easy to survey travel patterns of late-night travelers. It could be dangerous and reliability of survey data can be easily questioned or put up for debate.
In the face of these challenges, city officials in Seoul decided to use Big Data. Big Data can be utilized in tracing travel patterns of late-night travelers. The most plausible Big Data is the one from calls and text messages. In this case, three billion call and text data points made late at night were analyzed to find specific locations of departure and destination of travelers.
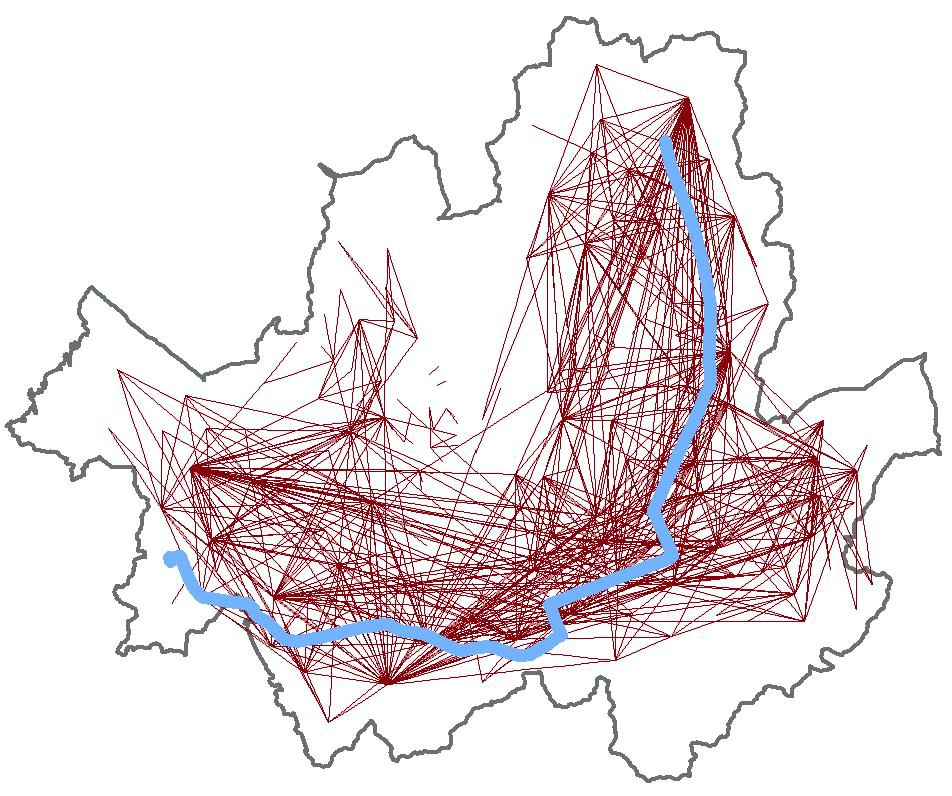
Tracing travel patterns in Seoul using Big Data
In brief, the call and text data provided the departing point, and the billing address of the user or traveler provided the arriving point. (See map of travel patterns at right.)
Experts now are understanding that departing and arriving points of travelers may be the most essential data in structuring bus routes. This data also provide crucial information regarding which routes late-night travelers actually use, including the road networks with the largest number of links and nodes. Furthermore, several simulation techniques were also introduced in order to find the travel routes most used.
In addition to call and text data, for example, five million data points of Taxi Digital Tacho Graphy (DTG) were used to revise bus routes. DTG is a device fitted to a vehicle that automatically records its speed and distance generating digital data that help manage taxis and prevent reckless driving. DTG systems are installed in all corporate and private taxis (more than 70,000 as of December 2013).
By utilizing only Big Data, without field surveys, nine late-night bus routes (so called owl bus routes) were designed, and they are currently operating between midnight and five o’clock in the morning.
And the response of late night travelers to the “owl bus” has been very positive, with 629,752 passengers who have reportedly used the new “owl bus” services. And that’s data for just the first 100 days. This shows once again that Big Data and an “owl bus” can have a lot do to with each other.
Or what do you think? What other great examples of Big Data and transport modes have you seen?


Join the Conversation