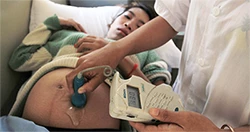
While these improvements are impressive, the national level data often mask inequalities in skilled birth assistance within countries. There may be gaps within a country, for example, where wealthy women might have better access than women from poor households. According to the World Health Organization, "The high number of maternal deaths in some areas of the world reflects inequities in access to health services, and highlights the gap between rich and poor."
As the World Bank pursues its twin goals – to end extreme poverty and promote shared prosperity – it is important to pay close attention to whether women from the bottom 40% of households have also enjoyed better access to health care services including skilled birth assistance. Using the Health Nutrition and Population Statistics by Wealth Quintile database, this blog identifies gaps in skilled birth assistance among wealthy and poor women within countries.
Q: Why is there a focus on births attended by skilled health personnel?
To reduce maternal deaths, it is necessary to improve access to maternal health care services such as prenatal checkups, dietary guidance, vaccinations, delivery assistance by skilled health personnel, delivery at health facilities, postnatal health care, and others. Of these indicators, delivery assistance by skilled health personnel is crucial to accelerate the reduction of maternal deaths. In developing countries, lack of quality health services and medical care during and immediately after delivery lead to high mortality risks for expecting mothers. Delivery assistance provided by doctors, nurses, and trained midwives can save the lives of mothers and children.
Q: What is a wealth quintile and how does this information help us better understand access to delivery assistance by skilled health personnel?
Households in a given country are ranked based on their level of assets, and then divided into five groups classified from the poorest quintile (Q1) to the wealthiest quintile (Q5). This quintile information is merged with health indicators for a given country. Since women from wealthy households tend to have better access to quality maternal health care, we often see gaps in access to delivery assistance by skilled health personnel among women from different wealth quintiles. We can also identify changes in the gaps over time. The detailed methodology of calculating wealth quintile can be found in the Demographic and Health Surveys, one of the main sources of the Health Nutrition and Population Statistics by Wealth Quintile database.
Q: So which countries show the largest and smallest gaps among women across wealth quintiles?
Source: Demographic and Health Surveys and Multiple Indicator Cluster Surveys
The most recent available data from 62 countries between 2007-2012 show that many countries in Sub-Saharan Africa have a large gap between the bottom 40th percentile (average of Q1 and Q2) and the top 40th percentile (average of Q4 and Q5). The gap is the largest in Angola and Nigeria, followed by Mauritania and Cameroon. In these countries, the gap is even more obvious when we compare women in the bottom (Q1) and the top (Q5) quintiles. While more than 90% of women in Q5 have access to delivery assistance by skilled health personnel, the share of women with the access in Q1 ranges only from 11 to 20%. In contrast, there are some countries with nearly 100% access for women across all five wealth quintiles. These countries include Albania, Armenia, Bosnia and Herzegovina, Jordan, Kazakhstan, Serbia, and the Ukraine.
How have the gaps changed over time?
We can use some country examples to illustrate how these gaps has narrowed or widened over time. The Health Nutrition and Population Statistics by Wealth Quintile database contains 71 countries with at least two data points to measure this change over time.
Case 1: The gap has widened in Nepal
Source: Demographic and Health Surveys
In Nepal, access to skilled birth attendance has improved for women from all quintiles. However, the gap between the bottom 40% and the top 40% widened from 17 (21 minus 4) to 48 (78 minus 30) percentage points between 1996 and 2011. This is because access among the top 40% of women improved much more than for the bottom 40% of women. Although the national level data indicate large improvements due to better access among women from relatively wealthy households, access to delivery assistance for women from poor households remains low.
Case 2: The gap has narrowed in Indonesia
Source: Demographic and Health Surveys
In Indonesia, access to delivery assistance also improved for women from all quintiles. Unlike Nepal, the gap between the bottom 40% and the top 40% has narrowed from 49 (78 minus 29) to 24 (96 minus 72) percentage points between 1997 and 2012. The proportion of births attended by skilled health personnel reached above 70% among the bottom 40% of women, which has contributed to significant improvements in total access at the national level.
Q: Where do I go to obtain more information on this subject?
The Health Nutrition and Population Statistics by Wealth Quintile database provides data by wealth quintiles on many health indicators including data on the subject of this blog.
Data Limitations: Wealth quintiles are based on household asset levels and are calculated with data from the Demographic and Health Surveys and Multiple Indicator Cluster Surveys. The definition of assets, however, varies across countries. Wealth quintiles are a relative measure, and not absolute. Thus, data comparisons across countries must be made with caution.
And please consider following us on Twitter at @worldbankdata for news and updates on the most widely followed measures of the global economy and our Open Data initiative.
Indicators and codes used in this post:
- Assistance during delivery (any skilled personnel) (% of births): Q1 (lowest) SH.STA.BRTC.Q1.ZS
- Assistance during delivery (any skilled personnel) (% of births): Q2 SH.STA.BRTC.Q2.ZS
- Assistance during delivery (any skilled personnel) (% of births): Q3 SH.STA.BRTC.Q3.ZS
- Assistance during delivery (any skilled personnel) (% of births): Q4 SH.STA.BRTC.Q4.ZS
- Assistance during delivery (any skilled personnel) (% of births): Q5 (highest) SH.STA.BRTC.Q5.ZS


Join the Conversation