
Last January 2017, the World Bank launched TCdata360 (tcdata360.worldbank.org/), a new open data platform that features more than 2,000 trade and competitiveness indicators from 40+ data sources inside and outside the World Bank Group. Users of the website can compare countries, download raw data, create and share data visualizations on social media, get country snapshots and thematic reports, read data stories, connect through an application programming interface (API), and more.
The response to the site has been overwhelmingly enthusiastic, and this growing user base continually inspires us to develop better tools to increase data accessibility and usability. After all, open data isn't useful unless it's accessed and used for actionable insights.
One such tool we recently developed is data360r, an R package that allows users to interact with the TCdata360 API and query TCdata360 data, metadata, and more using easy, single-line functions.
Why R?
R has been rising in popularity among researchers, economists, journalists and data scientists for the past several years, and data360r would allow the growing R community to easily access and analyze trade and competitiveness open data.

Retrieved from StackOverflow Blog
Not an expert R user? No need to worry! We made this R package easy-to-use to empower the entire gradient of R users – from the beginners to the experts. No need to find, download, and transform data from different sites and complex formats anymore. All this work is already done for you.
Why use data360r?
Here are four main reasons why you will benefit from using data360r:
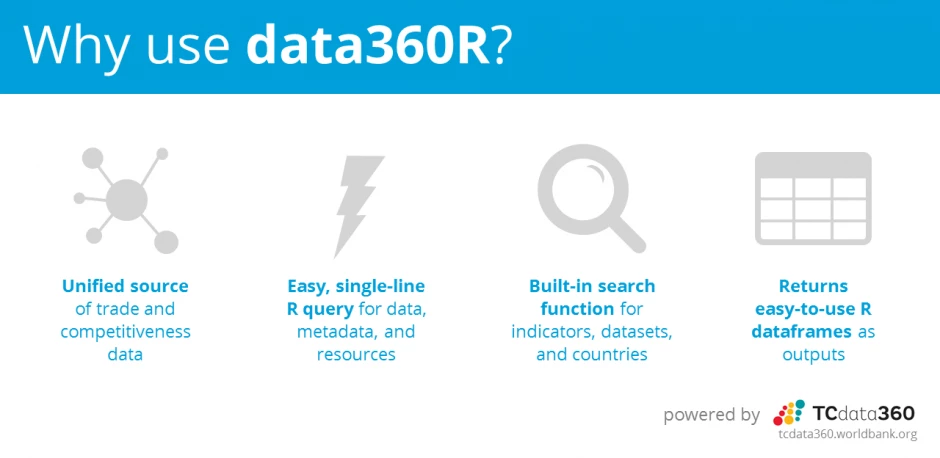
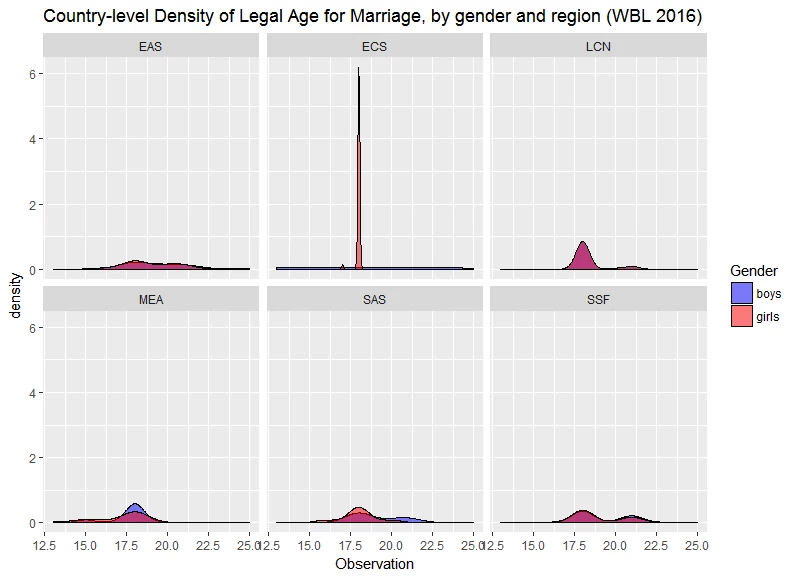
1. Command-line access to a unified source of trade and competitiveness data. No need to spend hours researching and compiling data from different sites anymore! TCdata360 has over 2000+ trade and competitiveness indicators from 40+ different sources.
For example, you can quickly generate complex charts such as these using R with TCdata360 indicator data and country metadata:
2. Easy, single-line query for TCdata360 data, metadata, and resources. This is great news, especially for our casual users who are unfamiliar with APIs. This package does all the grunt work of interacting with our TCdata360 API for you!
For example, you can quickly generate the list of all available indicators on TCdata360 together with their metadata:
> df get_metadata360(site='tc', metadata_type = 'indicators') |
3. Built-in search function for indicators, datasets, and countries. This is very useful for users researching on a specific topic, or exploring our vast number of indicators and data sources. Downloading the data you need just needs few lines of code.
For example, you can quickly search for the top TCdata360 indicator related to "woman business".
> search_360("woman business", search_type="indicator", limit_results = 1) Output:
|
4. Returns easy-to-use tables as outputs. Our API provides data in JSON (JavaScript Object Notation), which may not be a friendly format for all users. data360r converts these into a wide or long table format for you – perfect for exporting to and analyzing in Excel for beginners, or doing exploratory data analysis directly in R for experts.
| JSON response generated via API: |
Dataframe generated via data360r: |
 |
 |
That's just the tip of the iceberg. If you're interested to install and read more on data360r or see data360r in action, you can read some helpful data360r use cases with step-by-step examples using just a few lines of R code here: https://tcdata360.worldbank.org/tools/data360r
Conclusion: What's Next?
data360r opens up greater accessibility to Trade and Competitiveness open data for all types of users, ranging from beginner to the advanced R users. The single-line R-based data queries and built-in search function allow quick and easy implementation of different activities ranging from report generation to exploratory data analysis, ultimately contributing to package usability and user-friendliness.
Of course, this is just the beginning. Towards the overarching goal of increasing user engagement, we will continue to improve on the data360r package for better usability, and hopefully create similar wrappers for Python and Stata to widen our net to the bigger developer community in the near future.
These improvements complement existing R packages we've developed internally, such as the ReportGenerator360 (see https://github.com/asRodelgo/reportGenerator360) which generates the thematic country snapshots (e.g., Entrepreneurship and Tourism) published on the site, as well as the TCdatascoper (see https://alberto-sanchez-rodelgo.shinyapps.io/datascoper/), a cloud visualization that groups countries according to the main TCdata360 indicators across time. Both innovations are always up-to-date by pulling the latest data from the TCdata360 API.
We hope this blog provides new and better ideas to improve on TCdata360 and its tools. We definitely need more and better data for sure and that is why we have started a Data Science page in TCdata360. Check it out!
If you have ideas or questions for TCdata360, if you’ve tried out the data360r package, or if you’ve spotted any bugs, we’d be more than happy to see your findings and get your feedback! Drop us a message at tcdata360@worldbank.org, or tweet with the hashtag #tcdata360.
The conclusions and opinions expressed in this blog do not represent the views of the World Bank Group.


Join the Conversation