 The COVID-19 pandemic was responsible for the single largest annual increase in global inequality in the past three decades. Photo: Patricio Crooker / World Bank
This is the third blog in a series about how countries can correct course and make progress in global poverty reduction. For more information on the topic, read the 2022 Poverty and Shared Prosperity Report.
After global inequality increased for most of the 19th and 20th centuries, the world experienced three decades of reduction in the income gap among global citizens as poorer economies grew faster than richer ones. Yet, in 2020, the COVID-19 pandemic stopped this era of global personal income convergence. Global inter-personal incomes started to diverge because developing countries generally were hit harder by the pandemic than high-income countries, and the recovery since then has been uneven.
Utilizing the data available in the World Bank’s Poverty and Inequality Platform up to 2019 and triangulating various data sources for 2020, in what follows, we outline four key findings from this study.
Figure 1 shows the net income impact of the pandemic in 2020 on the global income distribution ranked from the poorest people on the left to the richest on the right. The figure highlights the global nature of the COVID-19 pandemic, with all percentiles experiencing a negative income shock. But those in the top 20 percentiles fared better than those in the bottom 80 percentiles. Those in the top 10 percentiles experienced the smallest shocks. The left-to-right upward incline of the curve in the figure suggests that global inequality increased in 2020.
Figure 1: Net impact of COVID-19 in 2020
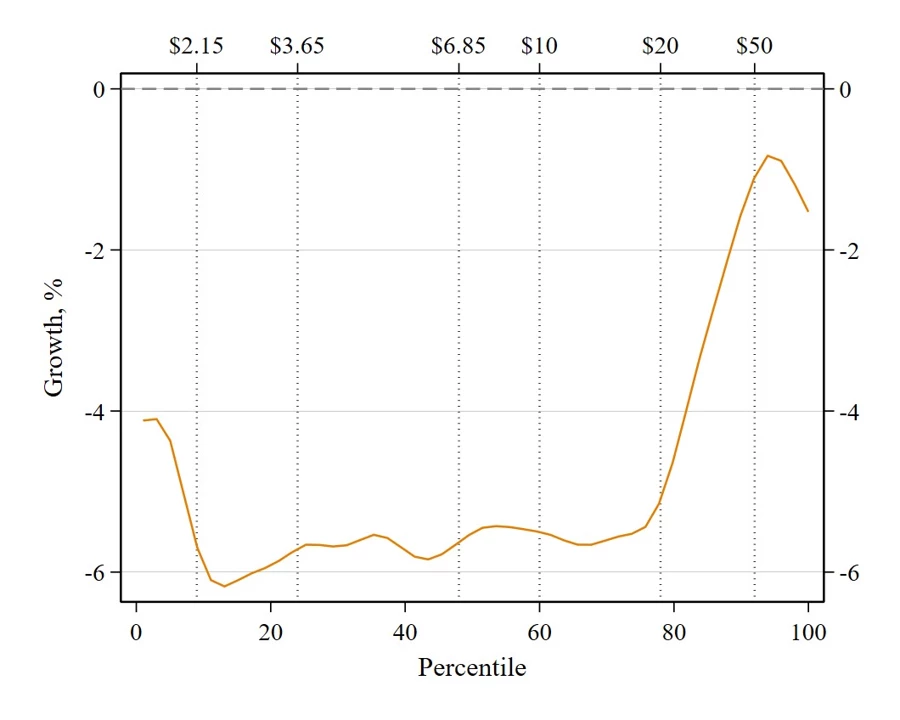
Source: Mahler ⓡ Yonzan ⓡ Lakner (2022).
The only other period of a marked increase in global inequality was during the Asian financial crisis when global inequality increased on average by nearly 0.4% annually between 1996 and 1999 (from a Gini index of 69 in 1996 to 69.9 in 1999).
In contrast, the COVID-19 shock likely increased global inequality by close to 1% in 2020 compared to 2019 (from a Gini index of 62 in 2019 to 62.6 in 2020). If we account for the decrease in global inequality expected in a world without the pandemic, we estimate a net impact of the pandemic on global inequality of 0.7 Gini points, or a 1.1% increase.
To understand the magnitude of the increase, consider that the average annual decline in global inequality in the five years preceding the pandemic was 0.13 Gini points. Returning to the pre-pandemic rate of reduction in the Gini, it will take us more than four years to wipe out the increase in global inequality experienced between 2019 to 2020.
Figure 2: Trend in global inequality 1990-2020
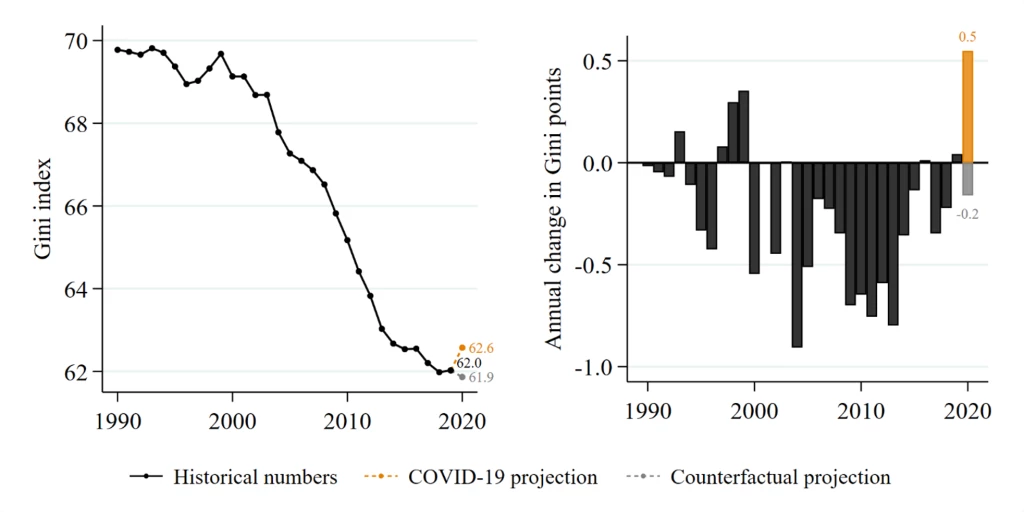
Source: Mahler ⓡ Yonzan ⓡ Lakner (2022).
Figure 3 reports the change in inequality within countries as the percent increase or decrease in the Gini index from 2019 to 2020. For many countries, there was either no change in inequality in the period or the change was small. The figure also shows that there are no clear patterns across countries. In cases where inequality fell, the poor fared relatively better than the rich – perhaps due to generous transfers (see World Bank 2022 for details).
Figure 3: Inequality within countries
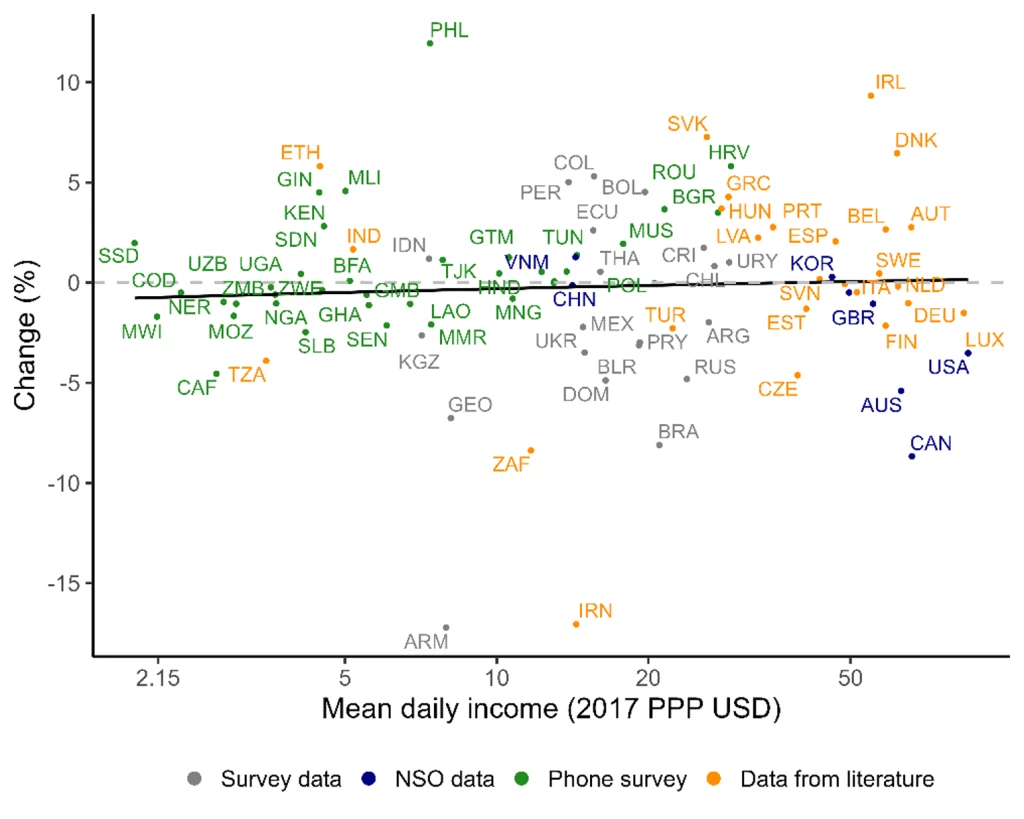
Source: Mahler ⓡ Yonzan ⓡ Lakner (2022).
Figure 4 illustrates the annual percent change in inequality between countries using the Mean Log Deviation (MLD). An increase in the MLD implies worsening inequality between countries, i.e., a divergence in average incomes across countries.
The COVID-19 pandemic led to the largest increase in inequality between countries over the last three decades. The reduction in between-country inequality was losing steam in the five years before the pandemic, yet, expectations were that there would be some convergence in 2020 (the Counterfactual series in Figure 4), but the pandemic wiped out years of progress.
Figure 4: Inequality between countries
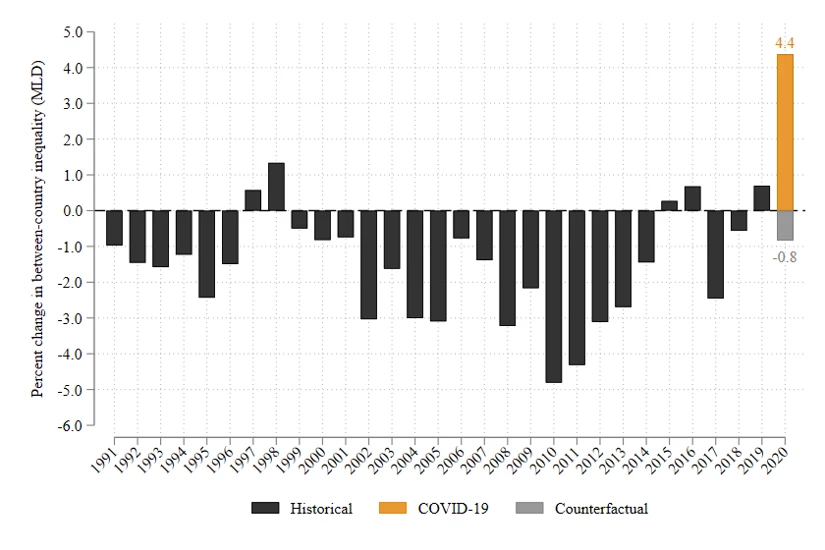
Source: Mahler ⓡ Yonzan ⓡ Lakner (2022).
The expected macroeconomic slowdown, the war in Ukraine — which affects not only the countries involved but the entire globe — and high inflation mean that an era conducive to income growth for countries at the bottom of the income distribution is on pause. Recovery is also proving to be comparatively more difficult for the poorest countries. Given the headwinds, we could now be in a world where global income convergence might be stalled for long periods or even reversed.
The authors gratefully acknowledge financial support from the UK Government through the Data and Evidence for Tackling Extreme Poverty (DEEP) Research Program.


Join the Conversation